Research Data Analyst

staff

Official Data for Decision Support

Official Data for Decision Support

Office of Institutional Research

Students Enrolled as of Census Date by Student Level

Level​Fall 2022​​Fall 2023​​Fall 2024​​Fall 2025​​Fall 2026
​Undergraduate1,7571,8101,9072,4923,352
​​Graduate​​​​​​232​263280279258
​​​Doctorate1728231921
​Total2,006​2,1012,2102,7903,631

Students Enrolled as of Census Date by Attendance Status

StatusFall 2022​​Fall 2023​​Fall 2024​​Fall 2025​​Fall 2026
​Full-time1,410​​​1,4931,6692,1633,065
Part-time​596608541627566
​Total​​2,0062,1012,2102,7903,631

Full-Time-Equivalent (FTE) Enrollment as of Census Date by Student Level

Level​Fall 2022​Fall 2023​Fall 2024​Fall 2025​Fall 2026
​Undergraduate1506.31549.861676.332229.83114.33
​​Graduate119.42150.34164.48160.83156.83
​​Doctorate​​​​10.7517.515.014.3315.25
*Total1,6371,7181,8562,0463,286

*Total rounded up to the nearest whole number (Based on EIS - Enrollment Information System)

Students Enrolled as of Census Date by Gender

Gender​Fall 2022​​Fall 2023​​Fall 2024​​Fall 2025​​Fall 2026
​Men466504573757926
​​Women1,5401,5971,6372,0332,705
​Total2,0062,101​​​2,2102,7903,631

First-time, Full-time, Degree-seeking Undergraduate Students as of Census Date

​Fall 2022​Fall 2023​Fall 2024​Fall 2025​Fall 2026
332​3704677471,240

Students Enrolled as of Census Date by Residency

Residency​Fall 2022​Fall 2023​Fall 2024​Fall 2025​Fall 2026
In-State1,706​​​​1,7461,7452,1332,323
Out-of-State​​​300355465​6571,308
Total2,006​​2,1012,2102,7903,631

Students Enrolled as of Census Date by Tuition Status

Tuition Status​Fall 2022​Fall 2023​Fall 2024​Fall 2025​Fall 2026
In-State1,702​​​​1,8131,9862,5643,352
Out-of-State​​​304288​224226279
Total​​2,0062,1012,2102,7903,631

Degrees/Certificates Conferred*

Degree/Certificate​FY 2022​FY 2023​FY 2024​FY 2025​FY 2026
​Upper Division Certificate​​55​​1511​13
Bachelor's335356299269271
Post-Bacc Certificate000189
​​Master's43473048​43
Post-Master's Certificate03644
Certificate of Adv. Study03110
​Doctorate538​​102
​Multiple Major1​4​217
Total389421361362349

*Updated to reflect degrees conferred after DIS submission to USM/MHEC as of 08/31/2026

Institutional Retention/Graduation Rates (First-time, Full-Time, Degree-Seeking Undergraduate Students)

Term​Fall 2022​Fall 2023​Fall 2024​Fall 2025​Fall 2026
​Fresh to Soph Retention62%74%66%75%70%
​4-Yr Graduation11%8%11%14%21%
​6-Yr Graduation24%26%26%21%23%

Faculty by Employment Status

Status​Fall 2021​Fall 2022​Fall 2023​Fall 2024​Fall 2025
Full-time​​126117​​​122120138
​Part-time​​​9697​91103101
​Total​222214213223239

Staff by Employment Status

Status​Fall 2021​Fall 2022​Fall 2023​Fall 2024​Fall 2025
Full-time​​​286275302290316
​​Part-time​38​34​​424626
​Total​324309344336342

Student Demographics, Fall 2025

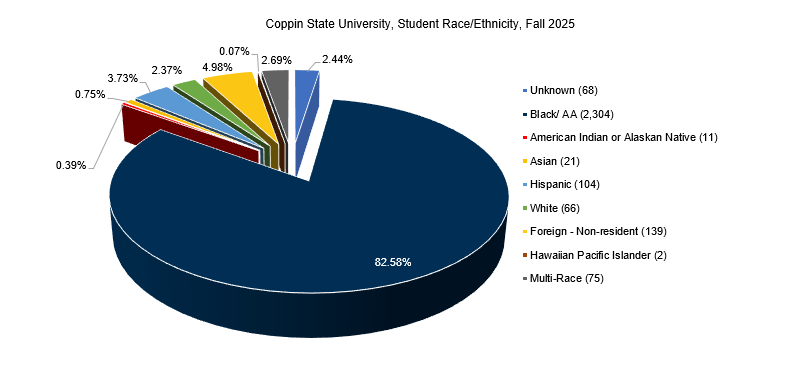
Donut chart depicting percentage breakdown of student race/ethnicity for Fall 2025. The percentages are as follows: 2.44% Unknown, 82.58% Black African-American, 0.39% Native American Alaska Native, 0,75% Asian, 3,73% Hispanic, 2.37% White, 4.98% Foreign Non Resident, 0.07% Hawaiian Pacific Islander, and 2,69% Multi-Race.
Note: *All figures derived using financial aid data are one year trailing
CriteriaNumber
Graduate:298 (10.7%)
​Undergraduate:​2,492 (89.3%)
​Full-time:2,163 (77.5%)
​Part-time: 627 (22.5%)
​Male:757 (27.1%)
​Female:2,033 (72.9%)
Fall 24 First Generation:64% (As a percentage of undergraduate students who received Financial Aid and enrolled in the fall semester)
Living on Campus:612
Average SAT:933 (Math & Evidence Based Reading & Writing)
Median Student Age:19
Mean Student Age:​26
*Fall 24 ​​Pell Recipients:​UGRD 1,087 (57%), First-time, Full-time - 71%
*Fall 24 UGRD Aid Recipients1,548 (62%), 66% merit/need based
Student to Faculty Ratio:12:1
Student to Staff Ratio:7:1

Other Information

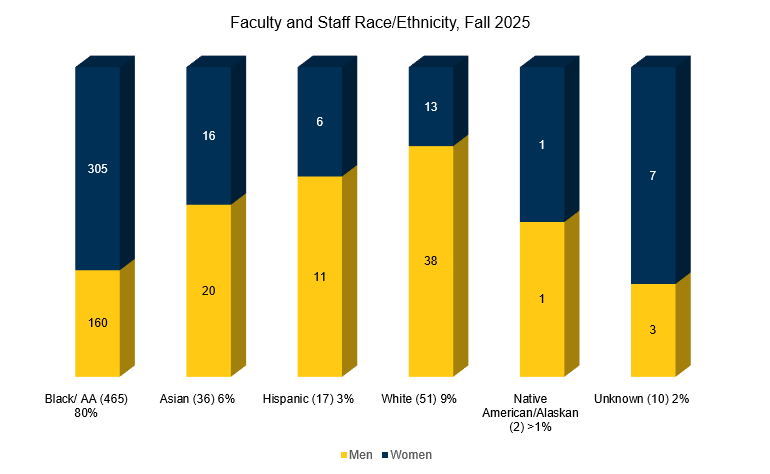
Bar Chart depicting faculty and staff demographics as of the Fall 2025 semester. The numbers are as follows: 160 Black men, 305 Black women, 20 Asian men, 16 Asian women, 11 Hispanic men, 6 Hispanic women, 38 White men, 13 White women, 1 Native American/Alaskan Native man, 1 Native American/Alaskan Native woman, 3 men of unknown race, and 7 women of unknown race.

Source: Coppin State University, Office of Institutional Research 

Last Updated: January 2026

Official Data for Decision Support

Official Data for Decision Support

Office of Institutional Research

Students Enrolled as of Census Date by Student Level

Level​Fall 2022​​Fall 2023​​Fall 2024​​Fall 2025​​Fall 2026
​Undergraduate1,7571,8101,9072,4923,352
​​Graduate​​​​​​232​263280279258
​​​Doctorate1728231921
​Total2,006​2,1012,2102,7903,631

Students Enrolled as of Census Date by Attendance Status

StatusFall 2022​​Fall 2023​​Fall 2024​​Fall 2025​​Fall 2026
​Full-time1,410​​​1,4931,6692,1633,065
Part-time​596608541627566
​Total​​2,0062,1012,2102,7903,631

Full-Time-Equivalent (FTE) Enrollment as of Census Date by Student Level

Level​Fall 2022​Fall 2023​Fall 2024​Fall 2025​Fall 2026
​Undergraduate1506.31549.861676.332229.83114.33
​​Graduate119.42150.34164.48160.83156.83
​​Doctorate​​​​10.7517.515.014.3315.25
*Total1,6371,7181,8562,0463,286

*Total rounded up to the nearest whole number (Based on EIS - Enrollment Information System)

Students Enrolled as of Census Date by Gender

Gender​Fall 2022​​Fall 2023​​Fall 2024​​Fall 2025​​Fall 2026
​Men466504573757926
​​Women1,5401,5971,6372,0332,705
​Total2,0062,101​​​2,2102,7903,631

First-time, Full-time, Degree-seeking Undergraduate Students as of Census Date

​Fall 2022​Fall 2023​Fall 2024​Fall 2025​Fall 2026
332​3704677471,240

Students Enrolled as of Census Date by Residency

Residency​Fall 2022​Fall 2023​Fall 2024​Fall 2025​Fall 2026
In-State1,706​​​​1,7461,7452,1332,323
Out-of-State​​​300355465​6571,308
Total2,006​​2,1012,2102,7903,631

Students Enrolled as of Census Date by Tuition Status

Tuition Status​Fall 2022​Fall 2023​Fall 2024​Fall 2025​Fall 2026
In-State1,702​​​​1,8131,9862,5643,352
Out-of-State​​​304288​224226279
Total​​2,0062,1012,2102,7903,631

Degrees/Certificates Conferred*

Degree/Certificate​FY 2022​FY 2023​FY 2024​FY 2025​FY 2026
​Upper Division Certificate​​55​​1511​13
Bachelor's335356299269271
Post-Bacc Certificate000189
​​Master's43473048​43
Post-Master's Certificate03644
Certificate of Adv. Study03110
​Doctorate538​​102
​Multiple Major1​4​217
Total389421361362349

*Updated to reflect degrees conferred after DIS submission to USM/MHEC as of 08/31/2026

Institutional Retention/Graduation Rates (First-time, Full-Time, Degree-Seeking Undergraduate Students)

Term​Fall 2022​Fall 2023​Fall 2024​Fall 2025​Fall 2026
​Fresh to Soph Retention62%74%66%75%70%
​4-Yr Graduation11%8%11%14%21%
​6-Yr Graduation24%26%26%21%23%

Faculty by Employment Status

Status​Fall 2021​Fall 2022​Fall 2023​Fall 2024​Fall 2025
Full-time​​126117​​​122120138
​Part-time​​​9697​91103101
​Total​222214213223239

Staff by Employment Status

Status​Fall 2021​Fall 2022​Fall 2023​Fall 2024​Fall 2025
Full-time​​​286275302290316
​​Part-time​38​34​​424626
​Total​324309344336342

Student Demographics, Fall 2025

Donut chart depicting percentage breakdown of student race/ethnicity for Fall 2025. The percentages are as follows: 2.44% Unknown, 82.58% Black African-American, 0.39% Native American Alaska Native, 0,75% Asian, 3,73% Hispanic, 2.37% White, 4.98% Foreign Non Resident, 0.07% Hawaiian Pacific Islander, and 2,69% Multi-Race.
Note: *All figures derived using financial aid data are one year trailing
CriteriaNumber
Graduate:298 (10.7%)
​Undergraduate:​2,492 (89.3%)
​Full-time:2,163 (77.5%)
​Part-time: 627 (22.5%)
​Male:757 (27.1%)
​Female:2,033 (72.9%)
Fall 24 First Generation:64% (As a percentage of undergraduate students who received Financial Aid and enrolled in the fall semester)
Living on Campus:612
Average SAT:933 (Math & Evidence Based Reading & Writing)
Median Student Age:19
Mean Student Age:​26
*Fall 24 ​​Pell Recipients:​UGRD 1,087 (57%), First-time, Full-time - 71%
*Fall 24 UGRD Aid Recipients1,548 (62%), 66% merit/need based
Student to Faculty Ratio:12:1
Student to Staff Ratio:7:1

Other Information

Bar Chart depicting faculty and staff demographics as of the Fall 2025 semester. The numbers are as follows: 160 Black men, 305 Black women, 20 Asian men, 16 Asian women, 11 Hispanic men, 6 Hispanic women, 38 White men, 13 White women, 1 Native American/Alaskan Native man, 1 Native American/Alaskan Native woman, 3 men of unknown race, and 7 women of unknown race.

Source: Coppin State University, Office of Institutional Research 

Last Updated: January 2026

Office of Institutional Research

Office of Institutional Research

Mon - Fri: 8:00 am - 5:30 pm
Henrietta Lacks Health & Human Services Building, Room 224
(410) 951-3495

Mission

The mission of the Office of Institutional Research (OIR) is to enhance institutional effectiveness with information and analysis to support research, planning, policy formation, and decision making. OIR reports directly to the Office of Planning and Assessment, takes the lead role in analytical and policy research and is the central administrative unit for disseminating data about the University to the administrators, faculty, staff, and students.

In fulfilling this mission, the OIR collects, preserves, edits, analyzes and interprets data as well as provide the highest quality and timely information to internal constituencies, the federal government, state legislature, University System of Maryland, Maryland Higher Education Commission (MHEC), and other governmental entities.

The OIR also supports critical academic initiatives of strategic importance to the University, such as program review, institutional assessment, student outcomes assessment, facility planning, data warehouse, etc. and provides assistance to students, faculty, and staff in conducting research to support University themes, academic planning priorities, and special projects.

Vision

The OIR vision is to respond to all the strategic information and analytical needs of CSU by applying and advancing the knowledge, theories, methods, and standards of institutional research, assessment, and planning to solve significant educational issues facing the institution.

Core Values

The OIR will strive to achieve its vision in the context of University-wide strategic themes. We place high value on:

  • Providing services characterized by personal and professional integrity.
  • Producing high quality work products.
  • Creating a nurturing environment responsive to individual professional growth and development.
  • Maintaining a spirit of openness, collegiality, and teamwork in all our work.
  • Diversity of ideas, creativity, opinions, backgrounds, life styles and experiences.
  • Making a better Coppin while enjoying work.

Official Data for Decision Support

Office of Institutional Research

Office of Institutional Research

Mon - Fri: 8:00 am - 5:30 pm
Henrietta Lacks Health & Human Services Building, Room 224
(410) 951-3495

Mission

The mission of the Office of Institutional Research (OIR) is to enhance institutional effectiveness with information and analysis to support research, planning, policy formation, and decision making. OIR reports directly to the Office of Planning and Assessment, takes the lead role in analytical and policy research and is the central administrative unit for disseminating data about the University to the administrators, faculty, staff, and students.

In fulfilling this mission, the OIR collects, preserves, edits, analyzes and interprets data as well as provide the highest quality and timely information to internal constituencies, the federal government, state legislature, University System of Maryland, Maryland Higher Education Commission (MHEC), and other governmental entities.

The OIR also supports critical academic initiatives of strategic importance to the University, such as program review, institutional assessment, student outcomes assessment, facility planning, data warehouse, etc. and provides assistance to students, faculty, and staff in conducting research to support University themes, academic planning priorities, and special projects.

Vision

The OIR vision is to respond to all the strategic information and analytical needs of CSU by applying and advancing the knowledge, theories, methods, and standards of institutional research, assessment, and planning to solve significant educational issues facing the institution.

Core Values

The OIR will strive to achieve its vision in the context of University-wide strategic themes. We place high value on:

  • Providing services characterized by personal and professional integrity.
  • Producing high quality work products.
  • Creating a nurturing environment responsive to individual professional growth and development.
  • Maintaining a spirit of openness, collegiality, and teamwork in all our work.
  • Diversity of ideas, creativity, opinions, backgrounds, life styles and experiences.
  • Making a better Coppin while enjoying work.

Official Data for Decision Support